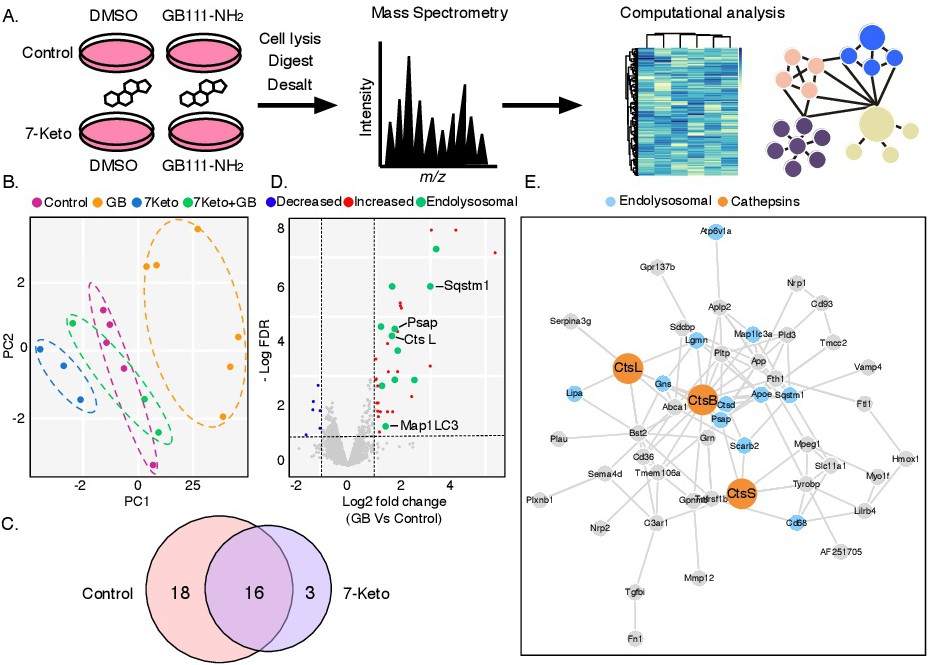
Fig. 3. Cathepsins are pivotal to lysosomal function. (A) Schematic description of experimental design. BMDMs were treated with GB111-NH2 or DMSO vehicle for 16 h followed by 7-Keto or a vehicle for another 4 h. Cells were subsequently lysed and proteins were further prepared for mass spectrometry analyses. (B) Principal component analysis (PCA) of protein expression in BMDMs treated as described in panel A. Each point represents a biological replicate. (C) Venn diagram showing the overlap between up-regulated proteins (e.g. GB111-NH2 vs. DMSO) in normal conditions or in response to 7-Keto. (D) Representative volcano plot showing differentially expressed proteins due to cathepsin inhibition by GB111-NH2. Differentially expressed proteins (log2 fold change ± 1 and FDR < 0.1) represented by different colors (red, up-regulated, green, up-regulated endolysosomal, and blue, down-regulated protein expression). (E) Cathepsin-proteolytic network showing potential interactions and putative cathepsin targets.